Difference between revisions of "TUFLOW Viewer - Map Outputs - 3D to 2D Depth Averaged Cross-Sections"
Ellis Symons (talk | contribs) |
Ellis Symons (talk | contribs) |
||
| Line 26: | Line 26: | ||
* [[TUFLOW_Viewer_-_Load_Results_-_Map_Outputs | Load Results - Map Outputs]] | * [[TUFLOW_Viewer_-_Load_Results_-_Map_Outputs | Load Results - Map Outputs]] | ||
* [[TUFLOW_Viewer#Map_Outputs | Map Outputs]] | * [[TUFLOW_Viewer#Map_Outputs | Map Outputs]] | ||
| + | * [[TUFLOW_Viewer_-_Map_Outputs_-_Plotting_Time_Series | Map Output - Plotting Time Series]] | ||
| + | * [[TUFLOW_Viewer_-_Map_Outputs_-_Plotting_Cross-Sections_And_Longitudinal_Profiles | Map Output - Plotting Cross-Sections and Longitudinal Profiles''']] | ||
| + | * [[TUFLOW_Viewer_-_Map_Outputs_-_Plotting_Flow | Map Output - Plotting Flow]] | ||
| + | * [[TUFLOW_Viewer_-_Map_Outputs_-_Curtain_Plot | Map Output - Curtain Plot]] | ||
| + | * [[TUFLOW_Viewer_-_Map_Outputs_-_Vertical_Profile | Map Output - Vertical Profile]] | ||
| + | * [[TUFLOW_Viewer_-_Map_Outputs_-_3D_to_2D_Depth_Averaged_Time_Series | Map Output - Plotting 3D to 2D Depth Averaged Time Series]] | ||
| + | * [[TUFLOW_Viewer_-_Map_Outputs_-_Plotting_Multiple_Locations | Map Output - Plotting Multiple Locations]] | ||
| + | * [[TUFLOW_Viewer_-_Map_Outputs_-_Plotting_From_Vector_Layer | Map Output - Plotting From Vector a Layer (e.g. shp file)]] | ||
| + | * [[TUFLOW_Viewer_-_Using_A_Secondary_Axis | Using a Secondary Axis]] | ||
| + | * [[TUFLOW_Viewer_-_Exporting_The_Drawn_GIS_Plot_Features | Exporting The Drawn GIS Plot Points / Lines]] | ||
| + | * [[TUFLOW_Viewer_-_Customising_The_Plot_Legend | Customising The Legend]] | ||
| + | * [[TUFLOW_Viewer_-_Customising_The_Plotting_Styles | Customising The Plotting Styles]] | ||
| + | * [[TUFLOW_Viewer_-_Customising_The_Plot_Axes | Customising The Plot Axes]] | ||
====Back to TUFLOW Viewer Page==== | ====Back to TUFLOW Viewer Page==== | ||
| − | * [[TUFLOW_Viewer# | + | * [[TUFLOW_Viewer#Plotting_Results | Back to TUFLOW Viewer Main Page]] |
Revision as of 20:29, 20 April 2021

Tool Description
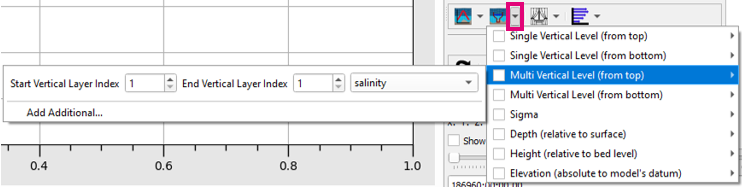
Extracts 3D to 2D depth averaged cross-section results along a polyline from the map outputs. Users can choose multiple methods and / or multiple instances of the same method with different parameters to plot at once. This tool expands on the cross-section plotting tool for 3D results as it lets users plot one or multiple 3D to 2D depth averaging methods at the same time (for example plot results from vertical layer 1, 2, 3.. etc). The standard cross-section plotting tool will plot only the current 3D to 2D depth averaging method being used to render the results.
For 2D depth averaged model results (i.e. TUFLOW Classsic / HPC) the 3D to 2D depth averaging methods will have no affect and produce identical result to each other.
To use the tool:
- Select the dropdown arrow next to the 3D to 2D Depth Averaged Cross Section icon
- Select (tick on) the 3D to 2D depth averaging method(s) - input appropriate parameters for the method and select the desired result type in the dropdown box
- Click off the drop down menu somewhere in a blank section of the TUFLOW Viewer toolbar
- Click the 3D to 2D Depth Averaged Cross Section icon so that it becomes indented and the cursor changes to a crosshair
- Left click in the QGIS map window to start drawing a line. Left click to add vertices to the polyline.
- Right click to finish drawing your line (note: line must contain at least 2 vertices and right clicking does not add a vertex)

To plot multiple instances of the same depth averaging method with different result types or different parameters, select Add Additional... in the dropdown menu. To uninclude additional methods from the plot, the methods can be unchecked, or can be removed completely by right clicking the method and selecting Remove Method.
Examples

Links
Similar Tools
- Load Results
- Load Results - Map Outputs
- Map Outputs
- Map Output - Plotting Time Series
- Map Output - Plotting Cross-Sections and Longitudinal Profiles
- Map Output - Plotting Flow
- Map Output - Curtain Plot
- Map Output - Vertical Profile
- Map Output - Plotting 3D to 2D Depth Averaged Time Series
- Map Output - Plotting Multiple Locations
- Map Output - Plotting From Vector a Layer (e.g. shp file)
- Using a Secondary Axis
- Exporting The Drawn GIS Plot Points / Lines
- Customising The Legend
- Customising The Plotting Styles
- Customising The Plot Axes