TUFLOW Viewer - Map Outputs - Plotting Cross-Sections And Longitudinal Profiles
Revision as of 20:24, 20 April 2021 by Ellis Symons (talk | contribs)

Tool Description
Extracts section results along a polyline from the map outputs. Users can choose one or multiple results types to plot at once. The tool will plot data from the current timestep, or maximum data if the result type has maximum toggled on. For 3D map outputs, the tool will use the current 3D to 2D depth average rendering method.
To use the tool:
- Select which result type to plot using the down arrow next to the cross-section icon in the toolbar
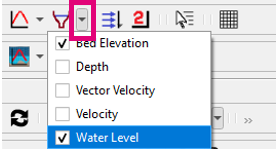
- Click off the drop down menu somewhere in a blank section of the TUFLOW Viewer toolbar
- Click the cross-section icon so that it becomes indented and the cursor changes to a crosshair
- Left click in the QGIS map window to start drawing a line. Left click to add vertices to the polyline.
- Right click to finish drawing your line (note: line must contain at least 2 vertices and right clicking does not add a vertex)

Examples
Cross-Section

Longitudinal Profile

Links
Similar Tools
- Load Results
- Load Results - Map Outputs
- Map Outputs
- Map Output - Plotting Time Series
- Map Output - Plotting Flow
- Map Output - Curtain Plot
- Map Output - Vertical Profile
- Map Output - Plotting 3D to 2D Depth Averaged Time Series
- Map Output - Plotting 3D to 2D Depth Averaged Cross-Sections
- Map Output - Plotting Multiple Locations
- Map Output - Plotting From Vector a Layer (e.g. shp file)
- Using a Secondary Axis
- Exporting The Drawn GIS Plot Points / Lines
- Customising The Legend
- Customising The Plotting Styles
- Customising The Plot Axes