Difference between revisions of "TUFLOW Viewer - Map Outputs - Plotting From Vector Layer"
Chris Huxley (talk | contribs) (→Links) |
|||
| Line 19: | Line 19: | ||
[[File:Plotting_From_Layer_Selection.gif]] | [[File:Plotting_From_Layer_Selection.gif]] | ||
| − | + | <br><br> | |
| − | + | '''Related Links''' | |
| − | * [[ | + | *[[TUFLOW_Viewer_-_Load_Results | Load All Results]] |
| − | * [[TUFLOW_Viewer_-_Map_Outputs_-_Plotting_Time_Series | Map Output - Plotting Time Series]] | + | *[[TUFLOW_Viewer_-_Load_Results_-_Map_Outputs | Load Results - Map Outputs]] |
| − | * [[TUFLOW_Viewer_-_Map_Outputs_-_Plotting_Cross-Sections_And_Longitudinal_Profiles | Map Output - Plotting Cross-Sections and Longitudinal Profiles | + | *[[TUFLOW_Viewer_-_Map_Outputs_-_Plotting_Time_Series | Map Output - Plotting Time Series]] |
| − | * [[TUFLOW_Viewer_-_Map_Outputs_-_Plotting_Flow | Map Output - Plotting Flow]] | + | *[[TUFLOW_Viewer_-_Map_Outputs_-_Plotting_Cross-Sections_And_Longitudinal_Profiles | Map Output - Plotting Cross-Sections and Longitudinal Profiles]] |
| − | * [[TUFLOW_Viewer_-_Map_Outputs_-_Curtain_Plot | Map Output - Curtain Plot]] | + | *[[TUFLOW_Viewer_-_Map_Outputs_-_Plotting_Flow | Map Output - Plotting Flow]] |
| − | * [[TUFLOW_Viewer_-_Map_Outputs_-_Vertical_Profile | Map Output - Vertical Profile]] | + | *[[TUFLOW_Viewer_-_Map_Outputs_-_Curtain_Plot | Map Output - Curtain Plot]] |
| − | * [[TUFLOW_Viewer_-_Map_Outputs_-_3D_to_2D_Depth_Averaged_Time_Series | Map Output - Plotting 3D to 2D Depth Averaged Time Series]] | + | *[[TUFLOW_Viewer_-_Map_Outputs_-_Vertical_Profile | Map Output - Vertical Profile]] |
| − | * [[TUFLOW_Viewer_-_Map_Outputs_-_3D_to_2D_Depth_Averaged_Cross-Sections | Map Output - Plotting 3D to 2D Depth Averaged Cross-Sections | + | *[[TUFLOW_Viewer_-_Map_Outputs_-_3D_to_2D_Depth_Averaged_Time_Series | Map Output - Plotting 3D to 2D Depth Averaged Time Series]] |
| − | + | *[[TUFLOW_Viewer_-_Map_Outputs_-_3D_to_2D_Depth_Averaged_Cross-Sections | Map Output - Plotting 3D to 2D Depth Averaged Cross-Sections]] | |
| − | * [[TUFLOW_Viewer_-_Using_A_Secondary_Axis | Using a Secondary Axis]] | + | *[[TUFLOW_Viewer_-_Using_A_Secondary_Axis | Using a Secondary Axis]] |
| − | * [[TUFLOW_Viewer_-_Exporting_The_Drawn_GIS_Plot_Features | Exporting The Drawn GIS Plot Points / Lines]] | + | *[[TUFLOW_Viewer_-_Exporting_The_Drawn_GIS_Plot_Features | Exporting The Drawn GIS Plot Points / Lines]] |
| − | + | *[[TUFLOW_Viewer_-_Customising_The_Plot_Legend | Customising The Legend]] | |
| − | + | *[[TUFLOW_Viewer_-_Customising_The_Plotting_Styles | Customising The Plotting Styles]] | |
| + | *[[TUFLOW_Viewer_-_Customising_The_Plot_Axes | Customising The Plot Axes]] | ||
| + | <br> | ||
{{Tips Navigation | {{Tips Navigation | ||
|uplink=[[TUFLOW_Viewer#Plotting_Results| Back to TUFLOW Viewer Main Page]] | |uplink=[[TUFLOW_Viewer#Plotting_Results| Back to TUFLOW Viewer Main Page]] | ||
}} | }} | ||
Revision as of 10:51, 2 June 2021
Tool Description
To plot from a vector layer, change From Map to Layer Selection in the dropdown box above the map plotting icons.

To initiate plot:
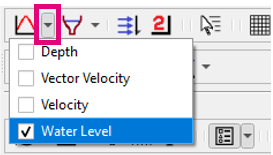
- Select which result type to plot using the down arrow next to the desired plotting type icon in the toolbar (e.g. time series).
- Select features in a vector layer (supported geometries: points, polylines).
- Click the desired plotting type icon to plot.

Depending on the plotting type, certain geometry types are expected. For example, for time series plotting, point geometries are expected. For cross-section plotting, polyline geometry is expected.
When plotting from a vector layer, the item is given a label in the plot legend based on the feature attributes. The index of which attribute to use can be changed via Settings >> Options under Map Plotting -> Label Field Index. Setting this value to a number that is greater than the number of attributes the layer has will turn this labelling method off and it will revert to similar labelling rules as From Map.

Examples

Related Links
- Load All Results
- Load Results - Map Outputs
- Map Output - Plotting Time Series
- Map Output - Plotting Cross-Sections and Longitudinal Profiles
- Map Output - Plotting Flow
- Map Output - Curtain Plot
- Map Output - Vertical Profile
- Map Output - Plotting 3D to 2D Depth Averaged Time Series
- Map Output - Plotting 3D to 2D Depth Averaged Cross-Sections
- Using a Secondary Axis
- Exporting The Drawn GIS Plot Points / Lines
- Customising The Legend
- Customising The Plotting Styles
- Customising The Plot Axes
| Up |
|---|