TUFLOW Viewer
Two versions of the TUFLOW Viewer are available.
New TUFLOW Viewer 2:
- The new TUFLOW Viewer 2 was updated as part of the 2026.0.0 QGIS TUFLOW Plugin release, hence has been available since March 2026.
- For all information, including switching from the original TUFLOW Viewer to the new TUFLOW Viewer 2, its functionality and the roadmap on outstanding features, refer to the TUFLOW Viewer Documentation.
Original TUFLOW Viewer:
- TUFLOW Viewer has been available since 2018.
- This following page documents the original TUFLOW Viewer, which replaces Crayfish and TUPLOT as the TUFLOW result viewer for QGIS (version 3.6 onwards). It uses the Mesh Data Abstraction Library (MDAL) available in QGIS to display and interact with TUFLOW map output results, and the TUFLOW results python library (the same library used by TUPLOT in earlier versions of QGIS) for viewing TUFLOW time series results.
Getting Started
QGIS Version
A few notes on the recommended QGIS version:
It is recommended to use the latest version of QGIS. The reasons for this are:
- TUFLOW Viewer is developed using the latest version, and although backwards compatibility is maintained as best as possible, TUFLOW Viewer is tested more frequently on the latest QGIS version.
- The mesh data provider (MDAL) and the temporal controller (which now underpins the mesh datasets in QGIS) are both relatively new in comparison to other libraries (e.g. GDAL) and are therefore more regularly updated with new features, enhancements, and bug fixes by the QGIS developers. TUFLOW Viewer takes advantage of these updates.
Although TUFLOW Viewer has been developed to be consistent across QGIS versions, it is not always possible. Some QGIS developments and behaviour changes have led to TUFLOW Viewer behaviour also changing either through necessity or to keep in-line with the QGIS development direction. The below is a current list of known behaviour changes due to QGIS version:
- Date-time format within TUFLOW Viewer - QGIS 3.14 introduced the temporal controller
- Prior to QGIS 3.14, TUFLOW Viewer stored all results internally as relative time. The user could display as date-time and the reference time by changing Zero Date in Settings >> Options.
- QGIS 3.14, TUFLOW Viewer tried to mimic the behaviour of previous versions but the reference time could also be altered natively in the mesh layer Properties. Note on this version, this is the first QGIS release with the temporal controller and as a consequence some of the functionality matured and changed in subsequent versions. Users may experience strange behaviour when using TUFLOW Viewer with the QGIS 3.14 if using date-time format. It is recommended to upgrade to later versions of QGIS if date-time format is required.
- Post QGIS 3.14 TUFLOW Viewer stores all results internally as absolute time and the user must change the reference time in the native properties of the mesh layer to alter the dates being displayed. Zero Date now only changes how the relative time is displayed in TUFLOW Viewer and doesn't change the mesh layer reference time.
- Please follow the link below on how to use isodate (date-time) format in TUFLOW Viewer in QGIS 3.16+ (recommended minimum version if using date-time format): Working With Isodate (Date-Time) format.
Other Known Issues
- QGIS 3.24 uses Matplotlib v3.5.1 which contains the following known bug which may affect users when re-labelling datasets within the TUFLOW Viewer plot window:
- "ValueError: Failed to find font DejaVu Sans:style=normal:variant=normal:weight=normal:stretch=normal:size=10.0, and fallback to the default font was disabled"
Installation or Version Upgrade
Installation
TUFLOW Viewer is a free tool that comes as part of the TUFLOW plugin in QGIS. For instructions on how to install the plugin, please follow these steps: Installation of Plugin.
There are also instructions on installing plugins in the QGIS documentation - if you choose to follow the QGIS documentation, the plugin is called "TUFLOW" in the repository: Link to QGIS Documentation - Installing and Managing Plugins.
Plugin Upgrades
It's recommended to upgrade the plugin whenever a new version is released. The upgrade process is typically done via the Plugin Manager (QGIS Drop Menu: Plugins >> Manage and Install Plugins).

If you encounter an error while upgrading the plugin please follow these steps: Error While Upgrading Plugin .
Development Version
It's possible to test out the latest development version of the plugin and TUFLOW Viewer by following the instructions here: Installing the Latest Development Version of the TUFLOW Plugin.
Using TUFLOW Viewer
Opening the TUFLOW Viewer
After installing the QGIS TUFLOW plugin, the TUFLOW Viewer tool can be opened by clicking the following icon in the plugin toolbar:

Loading Results
TUFLOW simulation results can be loaded two ways:
- Select File >> Load Results from the TUFLOW Viewer drop down menu.
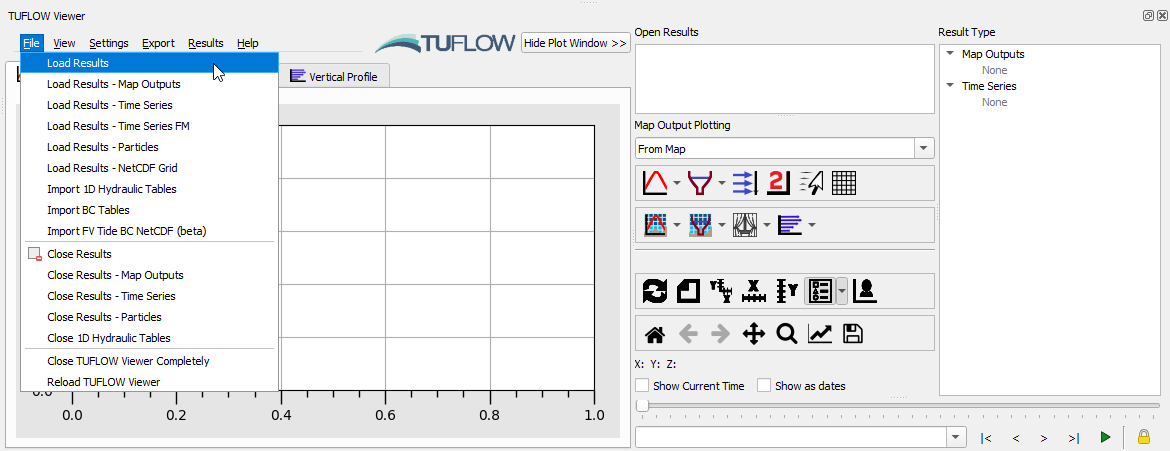
- Right Click in the Open Results panel and select Load Results.
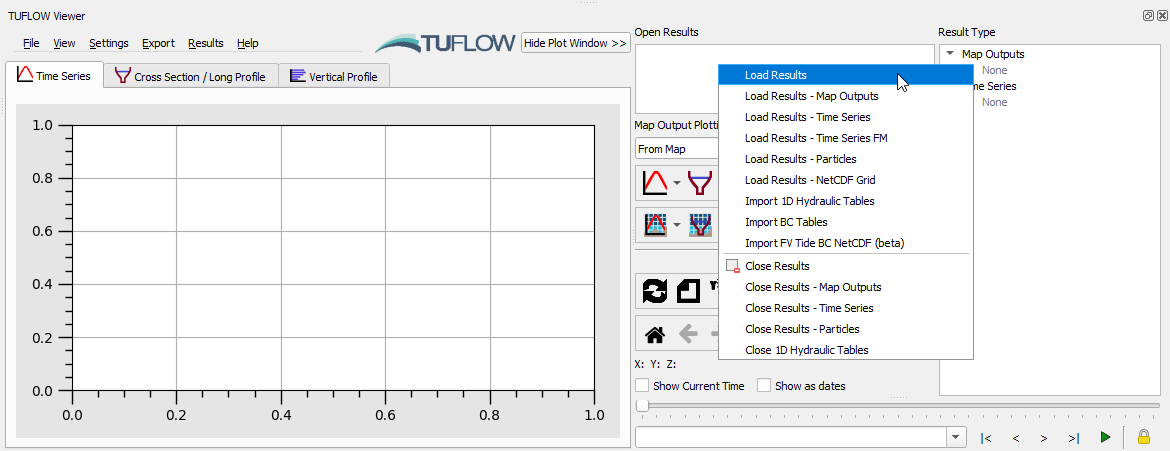


Using either of the above methods, the following result load options are available:
- Load All Results --> This is done via a TCF or TLF file and will load in all results (Map Outputs and ESTRY Time Series). Note: the Load All Results feature is not yet enabled for TUFLOW FV FVC files.
- Load Results - Map Outputs --> Select map output mesh results file (*.xmdf, *.dat, *.2dm, *.xmdf.sup, *.dat.sup, *.nc (supports netCDF format from TUFLOW FV output only)).
- Load Results - Time Series --> Select ESTRY / SWMM time series output results (*.tpc *.gpkg).
- Load Results - Flood Modeller Time Series --> Load Flood Modeller results. This requires a *.gxy and result *.csv file to be exported from Flood Modeller.
- Load Results - Particle Tracking Module --> Select output from particle module (*.nc) which will typically be suffixed with _ptm.
- Load Results - NetCDF Grid --> Load TUFLOW NC or HRNC map output results.
- Import 1D Hydraulic Tables --> Select a _1d_ta_tables_check.csv check file.
- Import 2D BC Tables --> Select a _2d_bc_tables_check.csv check file.
- Import 1D ESTRY Cross-Sections --> This will automatically happen if an appropriate TUFLOW input is opened in QGIS while TUFLOW Viewer is open (e.g. 1d_xs).
- Importing a User Defined Time Series Dataset To Display In The Plot Window
- Import FV Tide BC NetCDF
- Loading Results While TUFLOW is Running
Troubleshooting
If you receive an error similar to that shown below when attempting to load results from a TCF you will need to fix the encoding of your TUFLOW control files:
UnicodeDecodeError: 'utf-8' codec can't decode byte 0x92 in position 626: invalid start byte
This error is caused by incompatible encoding of the TUFLOW control files. You can resolve this issue by changing the encoding of all your TUFLOW control files to a single type (typically UTF-8). You can do this using Notepad++. Please see the following link for instructions on how to do this (refer last image): TUFLOW Message 0060.
TUFLOW-SWMM Results
Results from a linked TUFLOW-SWMM model can be loaded via the standard menu options (available from the TUFLOW plugin version 3.10):
- Load Results - Time Series To load the GPKG time series format (_swmm_ts.gpkg) by itself. The GPKG time series format is a new format similar to the .tpc with some additional functionality. More information can be found in the GPKG Time Series Format section.
- Load Results - Map Outputs To load in 2D map output results
- Load Results To load all available results from the model. This includes .xmdf, .tpc, and .gpkg results which could all be available for a given model run. Note that .tpc and .gpkg are both time series type results and will load separate GIS _PLOT_ layers.
GPKG Time Series Format
The GPKG time series format is a new format similar to the .tpc with enhanced temporal functionality. Currently the GPKG time series format is only supported as an output from SWMM in TUFLOW-SWMM linked models and only supported in TUFLOW Plugin version 3.10+ and QGIS 3.16+.
The GPKG format is different from the TPC format as it supports temporal styling in QGIS. As an example, the line width of the channels can be varied by both time and flow, with wider lines showing higher flow than thinner lines at a particular timestep. The format is fully compatible with the QGIS temporal controller and reacts dynamically as the temporal controller is updated. This results in a dynamic, and intuitive, method of showing the user the flood progression in the 1D system. Another benefit of being compatible with the core QGIS temporal capabilities is that the styling will also be dynamically updated if included in an animation export. TUFLOW Viewer's animation export tool has been updated to enable GPKG results to be exported with 2D results or even by itself.
The layer's styling can be automatically set using the TUFLOW Plugin via the layer's right-click context menu (under the TUFLOW submenu) or will automatically by styled if the results are loaded via TUFLOW Viewer. Examples of this format in QGIS are linked below:
The GPKG time series format is an open format and the specification is detailed at the below link:
Data Selection, Display and Styling
Map Output
Map Outputs are the time varying 2D result outputs from TUFLOW (or 3D outputs from TUFLOW FV). Data selection, display, styling and plotting instructions for Map Output results in TUFLOW Viewer are described below:
- Load Map Output results either via:
- Reload Results --> Reload and update results
- Change Simulation Result Selection --> Changing between different simulation results is done by selecting the result name(s) in the 'Open Results' widget.
- Change Result Type Selection --> Changing between different result types is done using the 'Result Type' widget.
- Display Result Maximum --> If available, maximums can be toggled on/off for the different result types.
- Display Vectors --> Vector results can be displayed in combination with any of the scalar result types (e.g. velocity vectors can be displayed with depth).
- Style Scalar Map Outputs --> Styling scalar map output results is similar to styling raster layers in QGIS.
- Style Vector Map Outputs --> Similar to the styling the scalar map outputs, there are a range of options for styling the vector layers.
- Save Default Styles --> Users can save default styles for result types so they are automatically applied each time results are imported using TUFLOW Viewer.
- Display The Mesh --> The quickest way to toggle the mesh is to click the grid box in TUFLOW Viewer.
- 3D to 2D Depth Averaging --> For 3D map output results, the 3D to 2D depth averaging method can be changed in the layer properties.
- Lock/Unlock Output Time Steps from Different Result Datasets --> Locking Plot Output Timesteps to the Map Output Interval.
- Working With Isodate (Date-Time) Format --> View results using absolute time format (dd/mm/yyyy hh:mm:ss) instead of relative time format (hh:mm:ss).
- Map Output Plot - Plotting Time Series --> Plotting Map Output results.
- Map Output Plot - Plotting Cross-Sections and Longitudinal Profiles --> Plotting Map Output results.
- Map Output Plot - Plotting Flow --> Plotting Map Output results.
- Map Output Plot - 3D Curtain Plot --> Plotting Map Output results.
- Map Output Plot - 3D Vertical Profile --> Plotting Map Output results --> Plotting Map Output results.
- Map Output Plot - Plotting 3D to 2D Depth Averaged Time Series --> Plotting Map Output results.
- Map Output Plot - Plotting 3D to 2D Depth Averaged Cross-Sections --> Plotting Map Output results.
- Map Output Plot - Plotting From Vector a Layer (e.g. shp file) --> Plotting Map Output results.

Time Series Output
Time series outputs are typically 1D result outputs or 2D time series results (plot outputs or reporting locations). Time series results consist of two elements, the result datasets and GIS layers that the user can interact with to customise the plot selection in TUFLOW Viewer.
- Load time series output results either via:
- Load All Results, or
- Load Results - Time Series for TUFLOW models, or:
- Load Results - Time Series Flood Modeller for TUFLOW linked Flood Modeller 1D models.
- Time Series Output - GIS Data
- Time Series Output - Plotting Time Series
- Time Series Output - Plotting Longitudinal Profiles
- Identifying Selected Elements and Selecting Sub-Sets
- Plotting 1D Cross-Section Inputs (with / without results)
- Plotting 1D Hydraulic Table Check Files
- Extracting Median and Mean Time Series - Australian Rainfall and Runoff
- Plotting 1D Flow Regime
- Plotting 2D Boundary Condition Tables
- Lock/Unlock Output Time Steps from Different Result Datasets
- Working With Isodate (Date-Time) Format

Particle Tracking Output
- Particle Tracking Outputs
- Working With Isodate (Date-Time) Format
- Lock/Unlock Output Time Steps from Different Result Datasets

General Plot Display Options
- Summary of Plotting Toolbar Options
- Using a Secondary Axis
- Using a Date Axis
- Displaying the Current Time
- Customising The Legend
- Customising The Plotting Styles
- Customising The Plot Axes
- Plot Grid Line Display
- Importing a Custom Colour Ramp For The Curtain Plot
- Navigating And Querying The Plot
- Auto Update Plot From Cursor Location
- 3D Mesh Vertical Layer Display
- Hiding the Plot Window
- Customising the Plot Background Colour
- Setting the Default Font Size For the Plot
- Lock/Unlock Output Time Steps from Different Result Datasets
- Changing the Icon Size
- Settings Options

Exporting Animations, Data, Plots and Maps
TUFLOW Viewer offers the ability to export animations, data interegation points/lines, maps and plots:
- Exporting An Animation
- Exporting and Copying a Plot
- Exporting The Drawn GIS Plot Points / Lines
- Batch Exporting Maps
- Batch Exporting Plots


Python Error Troubleshooting
Occasionally the TUFLOW plugin will throw an exception and this will produce a Python Error which is displayed either as a yellow banner at the top of the map window or a window may appear stating than an 'Error has occurred while executing Python code'.
![]()
When this occurs it means that the TUFLOW plugin has encountered something unusual or a situation that it does not know how to handle (i.e. it has reached a line in the code that has failed to execute and as a consequence Python has bailed out). This means all the code below this point that was meant to execute has not. This can have knock-on consequences as variables may not exist or be set to incorrect values and signal handling (e.g. what happens when a menu item is clicked) may be broken. As such, a python error can lead to further python errors that would normally not have occurred. Because of this flow-on effect the first python error is usually the most important.
If you encounter a python error please:
- Email the Stack Trace to support@tuflow.com with a description of the steps that produced the python error (as best you can describe it). This is to help us identify bugs and fix the plugin so that it catches this exception in the future.
- If you find that you are now experiencing further python errors (probably caused by the initial error) you can try the following alternative in order of severity (least to worst):
- On the TUFLOW Viewer menu bar File >> Reload TUFLOW Viewer - this will reload TUFLOW Viewer, resetting all variables and signals. You will be required to load in any time series results again and other settings may also be reset. Map output results will remain in the workspace and be reloaded into TUFLOW Viewer.
- Save the QGIS workspace (.qgz) and restart QGIS.
- Restart QGIS - you can save the workspace (.qgz), however you should first select on the TUFLOW Viewer menu bar File >> Close TUFLOW Viewer Completely - this will close the Viewer and also remove all settings associated with it from the workspace so that the problematic variable is not accidentally reloaded with the workspace.
- The last resort option is to restart QGIS and load and create a new workspace from scratch (do not load a saved workspace).
| Up |
|---|
| Up |
|---|